Annual Gender Pay Gap figures published
Since we started reporting our Gender Pay Gap (GPG) eight years ago, Equity, Diversity and Inclusion (ED&I) has become an increasingly important focus for our organisation and we've made significant progress, with support from several external organisations which have expertise in this area.
The biggest driver of our gender pay gap remains the shape of our workforce which has a predominance of women at the more junior levels and fewer women in senior leadership roles. Building a more gender balanced workforce is a challenge that most financial services organisations face, which is why HM Treasury set up the Women in Finance Charter. We are proud to be signatories of this Charter and reported against our targets for the first time this year, achieving four of our five of them. While we are still to reach 30% female representation in Senior Management, we have been making progress since first setting the target in June 2022.
Of course, while increased diversity of our workforce is a key goal, the E (Equity) and I (inclusion) of ED&I are equally important and interlinked so we are pleased that our progress in these areas continues to attract external recognition. This year we retained The Employers Network for Equality and Inclusion (enei) Silver Talent Inclusion and Diversity Evaluation (TIDE) Mark for the fourth year. This involves a comprehensive assessment of several areas, including workforce, leadership and training. We were also included in Great Place to Work's Best Workplaces for Women listing for the sixth year running and feedback from our employees indicates that we are driving the right culture. However, we know there is much more to be done and remain committed to maintaining our focus on improving our workforce diversity at all levels over the long term and achieving our ambition of becoming a more diverse workplace.
The highlights below give an overview of progress made in 2024 and what is coming up in 2025.
What are we doing to improve our GPG?
Key Highlights
- Developed a new People strategy which represents an important shift in positioning from people process delivery to driving our ED&I vision.
- Refreshed our Wellbeing strategy to ensure closer alignment to and support of our ED&I activities. This included signing up to BITC's Workwell Commitment, providing a framework for embedding health and wellbeing which is aligned to our ED&I vision into our organisational culture.
- Having achieved four out of five phase one targets, set as part of our HM Treasury Women in Finance Charter commitment, we published phase two targets at the start of the year which we will report against in early 2025.
- Our ED&I SteerCo, made up predominately of Group ExCo members, and Inclusioneer workforce champions, with leads for each protected characteristic, have continued to drive forward our ED&I strategy and action plan.
- Maintained partnerships with BITC (Business in the Community), Everywoman and enei (Employers Network for Equality and Inclusion) who continue to provide expert guidance and advice.
- Developed links with other organisations to support our progress and help us understand best practice in relation to ED&I.
- Progressed our membership of the Automotive 30% Club through awareness building and inclusive leadership initiatives.
- Following PRA/FCA D&I consultation output on new regulatory measures to enhance D&I in financial services firms, we carried out a gap analysis to identify any areas for improvement.
- Built on our staff inclusion calendar which includes key faith festivals and awareness events, including National Inclusion Week.
- Continued to support colleagues going through key life stages through our parenting and menopause socials and associated policy documents.
- Built on our award-winning ED&I internal podcast series which celebrates diversity and develops understanding within our colleague population with new episodes on topics including; choosing to be childless, living with Autism, employment barriers for the disabled and coping with cancer diagnosis, amongst others.
- Continued to embed our learning and development offering in support of our ED&I agenda which includes:
- Everyday Allyship - mandatory training programme for all people leaders to build understanding and encourage support
- Blazing my Trail - a programme designed to help staff build their confidence to reach their full potential
- Connect & Learn - a scheme to encourage staff to learn more about the people and teams who make up our diverse businesses
- MentorMe - our mentoring and reverse mentoring scheme, which supports talent progression and broadens understanding, particularly amongst more experienced employees, was relaunched making it easier for staff to engage and to track progress
- Held briefings, webinars and lunch and learn sessions to update staff on the progress we are making in relation to our ESG strategy, including our ED&I focus area, and to increase understanding of how they can support these initiatives.
- Continued to raise staff awareness about the importance of sharing personal data to help us to monitor our progress in relation to creating a diverse workforce.
- Maintained our commitment to ensuring diverse shortlists for roles and to progress and develop internal talent. This has been a focus in both Talent Boards and Succession planning conversations.
What else are we doing in 2025?
- We will continue to participate in Business in the Community (BITC) Workwell Benchmark assessment that enables organisations to measure and improve their approach to wellbeing within the workplace.
- Our ED&I SteerCo and Inclusioneers will continue to evolve our ED&I strategy and action plan based on input from all key stakeholders.
- As members of the Automotive 30% Club, we will be demonstrating our ongoing commitment to inclusive leadership in the automotive sector by supporting key initiatives.
- We will continue to run regular ESG briefings and engagement opportunities for staff throughout the year to keep them engaged and informed about our progress on ED&I as well as our wider ESG priorities.
- As signatories of HM Treasury's Women in Finance Charter we will report against our phase two targets at the start of 2025.
- We will continue to encourage staff to disclose their personal data so that we have more robust data to provide insight and guide our progress.
- We will continue to maintain our focus on personal development for the wider employee base and evolve our learning and development offering to support our ED&I agenda.
- We will continue to work in partnership with BiTC (Business in the Community), Everywoman and enei (Employers Network for Equality and Inclusion), using their tools and expertise to drive forward our ED&I strategy and plans for 2025.
- We will continue to develop our award-winning podcast series and promote events and dates that celebrate diversity and encourage a culture of inclusion.
What is the gender pay gap?
The GPG figures look at pay in the organisation from top to bottom, removing any notion of seniority, length of service, or specialism. Our GPG figures give an indication of male and female representation within the hierarchy of the business rather than an indication of a difference in male and female pay in the same role.
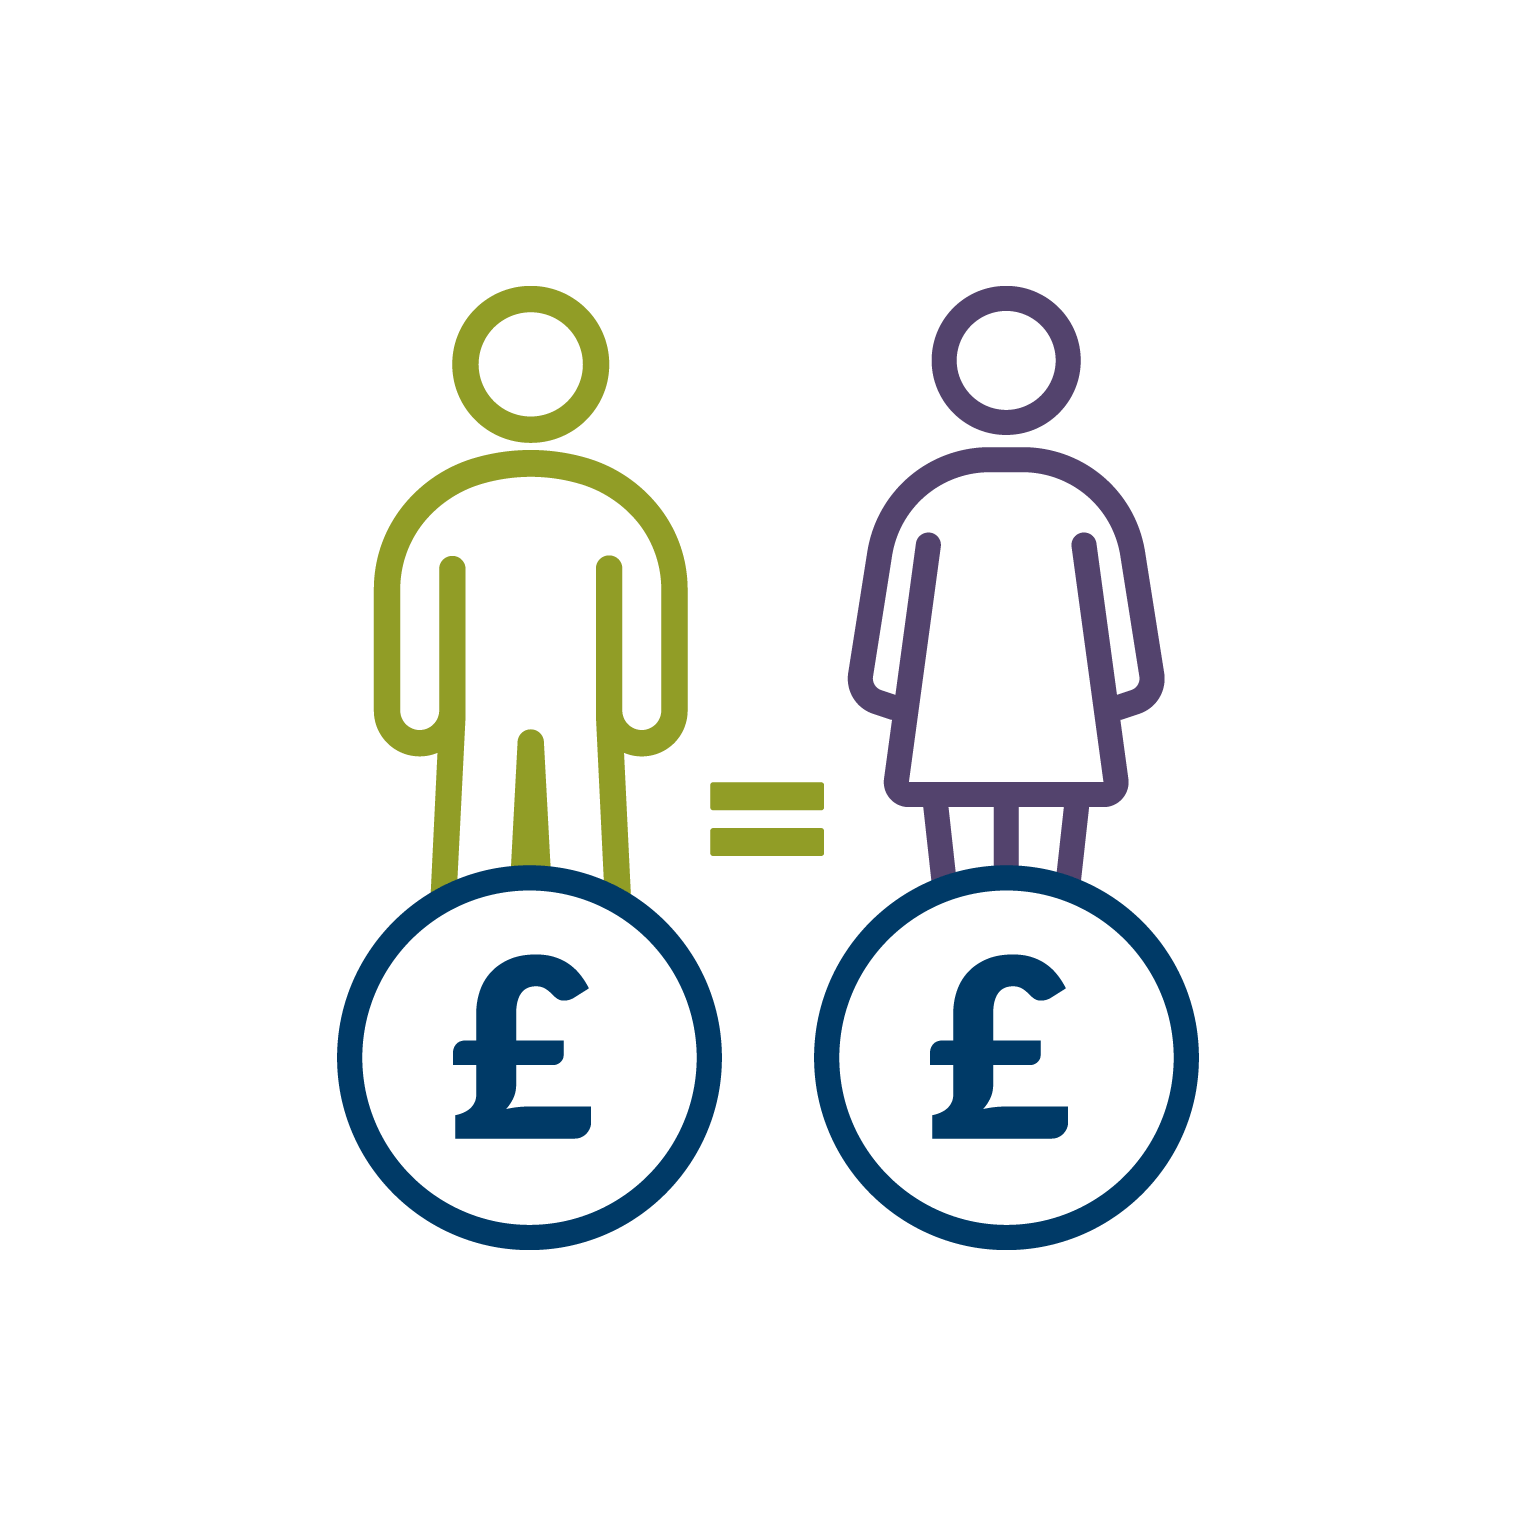
Equal pay
Men and women being paid the same for the same work.
The Gender Pay Gap
The difference between total hourly earnings for all men when compared to the total hourly earnings of all women within an organisation.
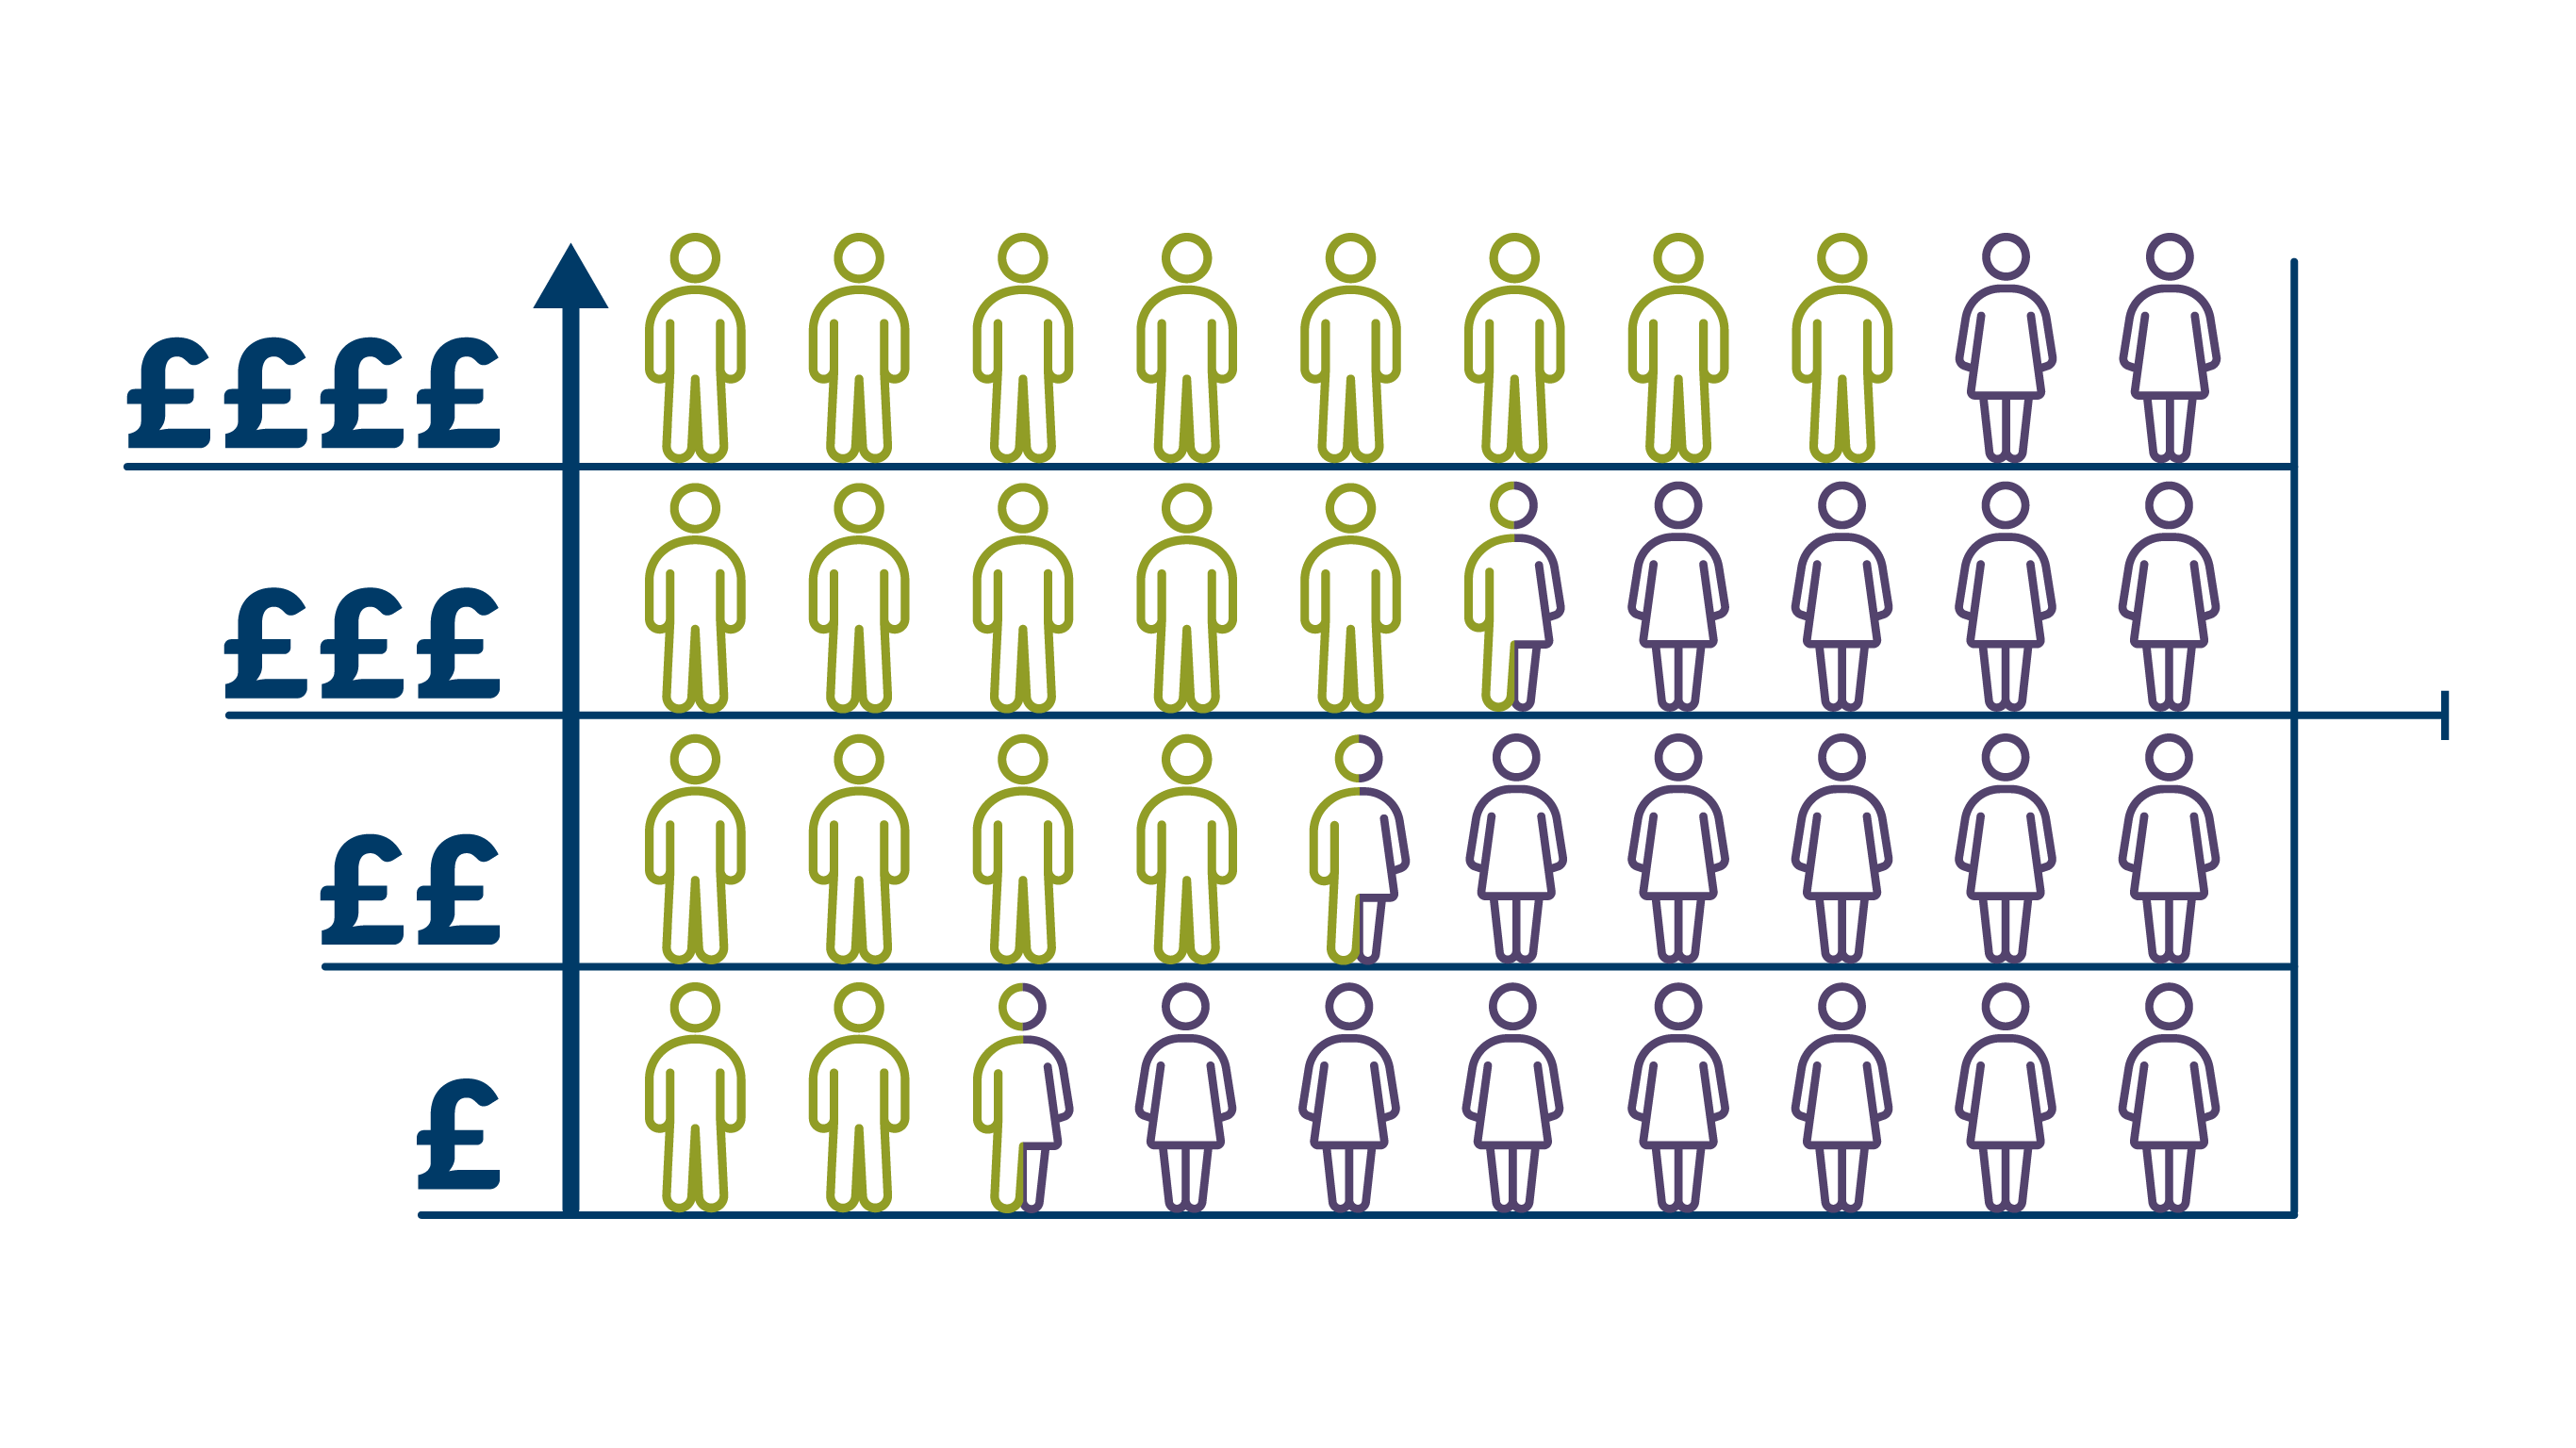
Nationally, one of the main reasons for the Gender Pay Gap is that men are more likely to be in senior roles. As with other Financial Services companies this is the case at STB.
How is the Gender Pay Gap calculated?

The STB median Gender Pay Gap is 23.7%

The STB average Gender Pay Gap is 35.0%
Results
These figures relate to Secure Trust Bank only as V12 Retail Finance is not currently included in government reporting requirements.
Results for Secure Trust Bank
Hourly Pay
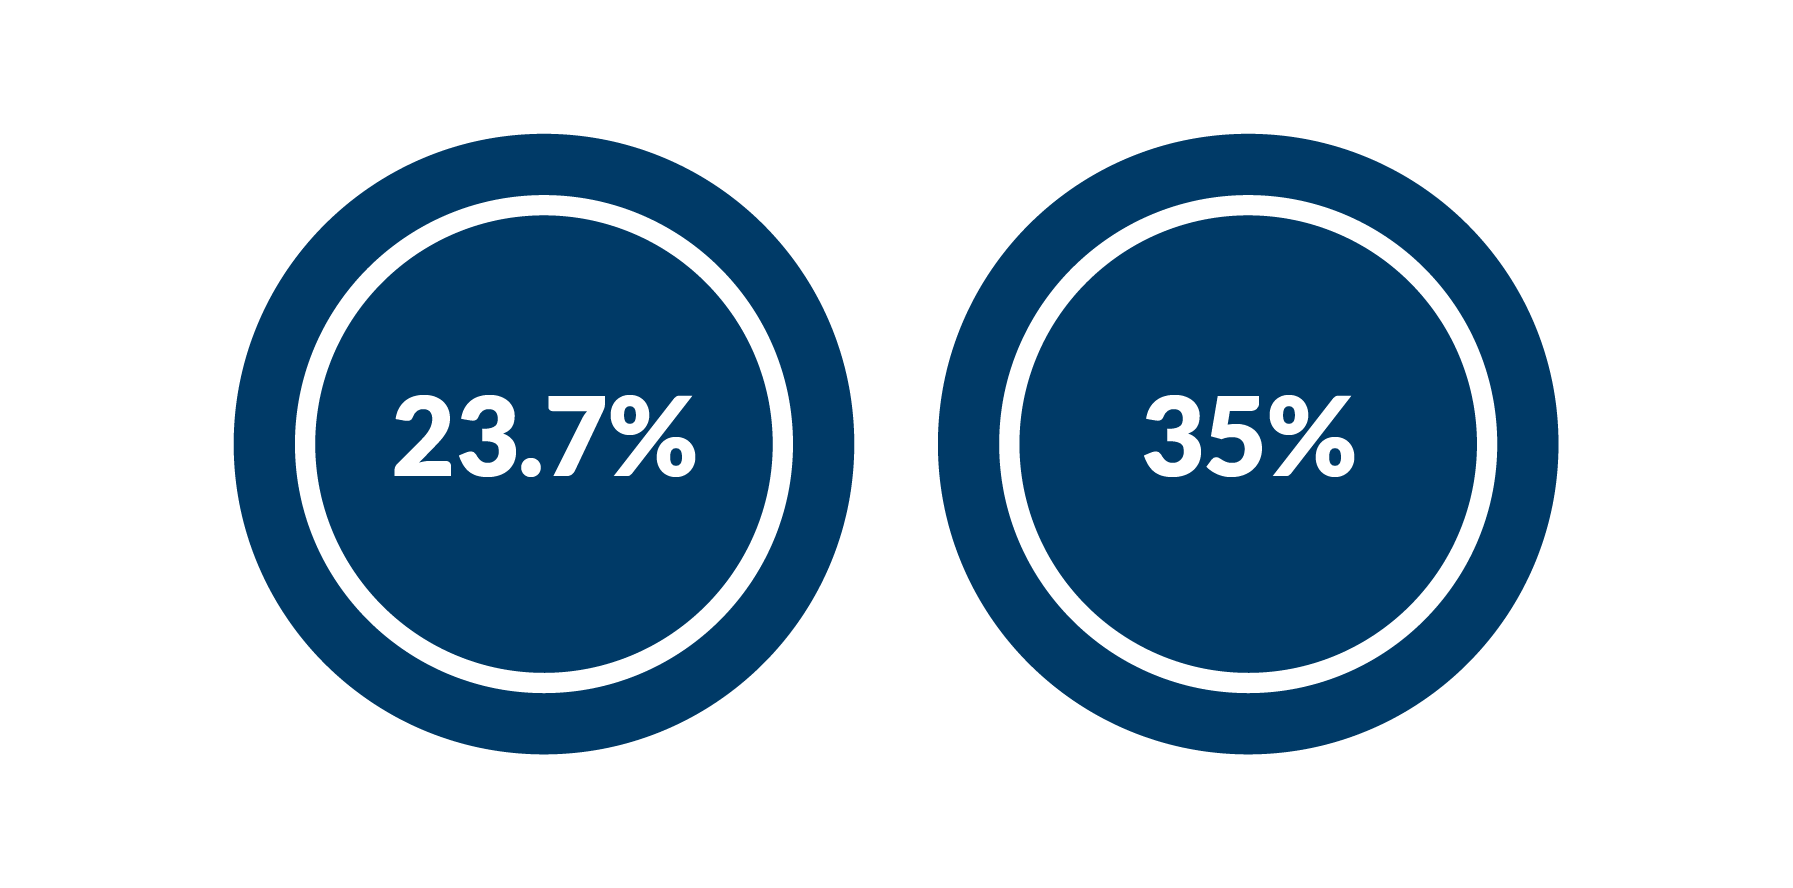
Gender Pay Gap median 23.7%
Gender Pay Gap average 35.0%
Bonus Pay
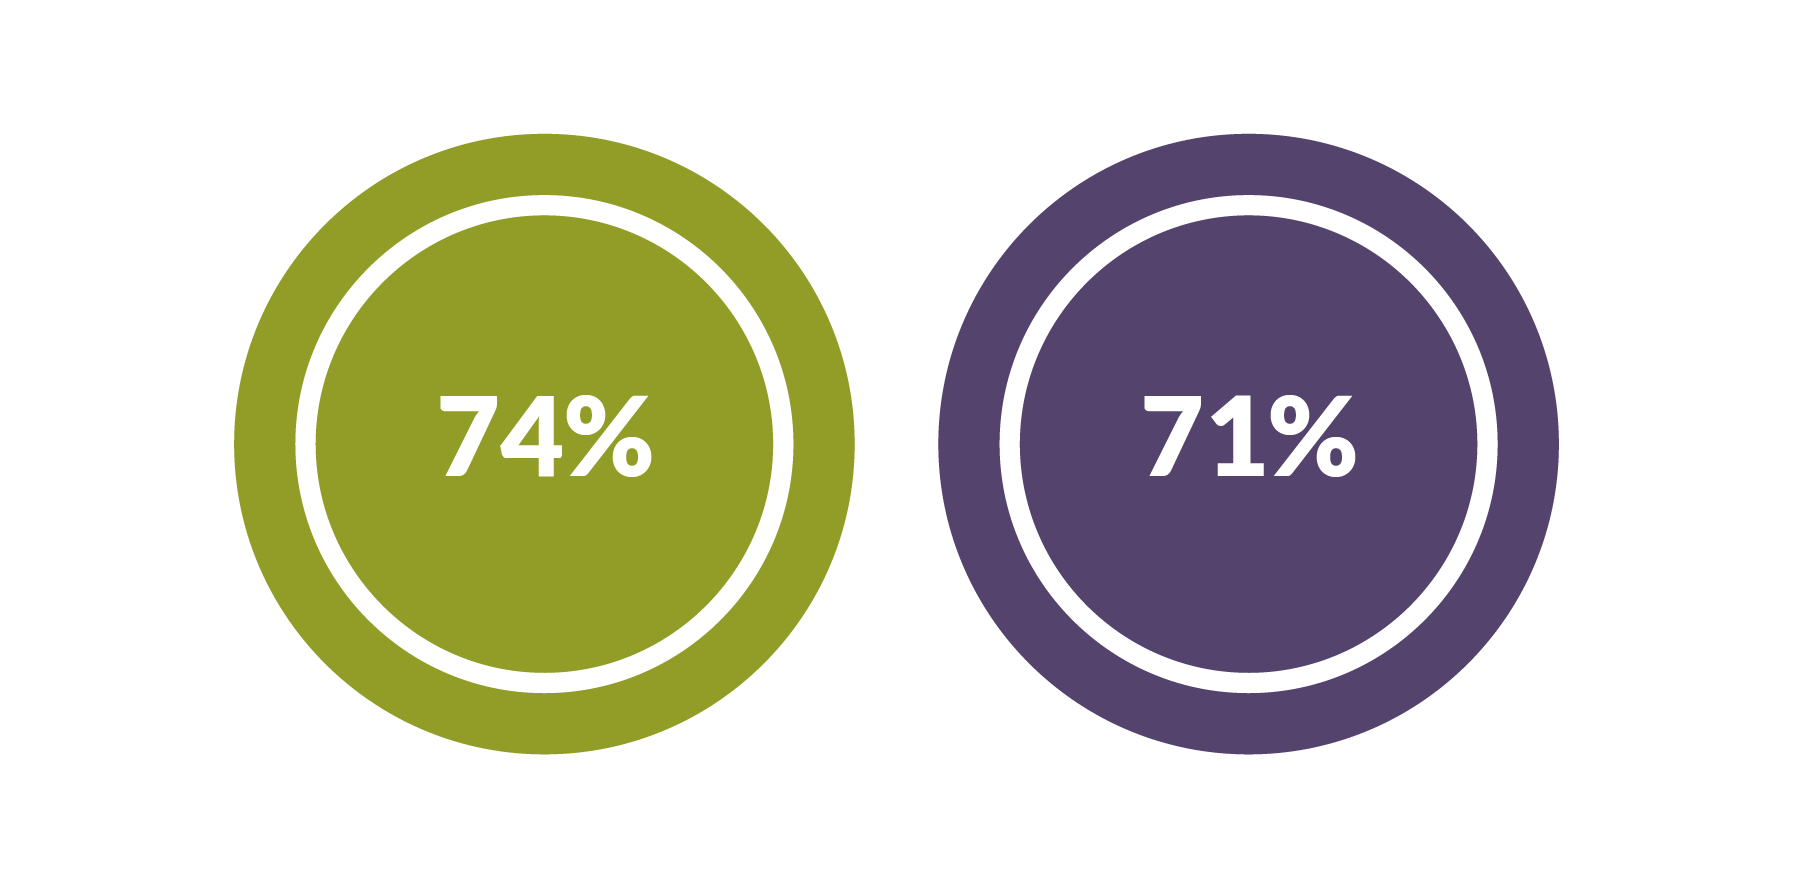
74% men received bonus
71% women received bonus
Bonus Gap Pay
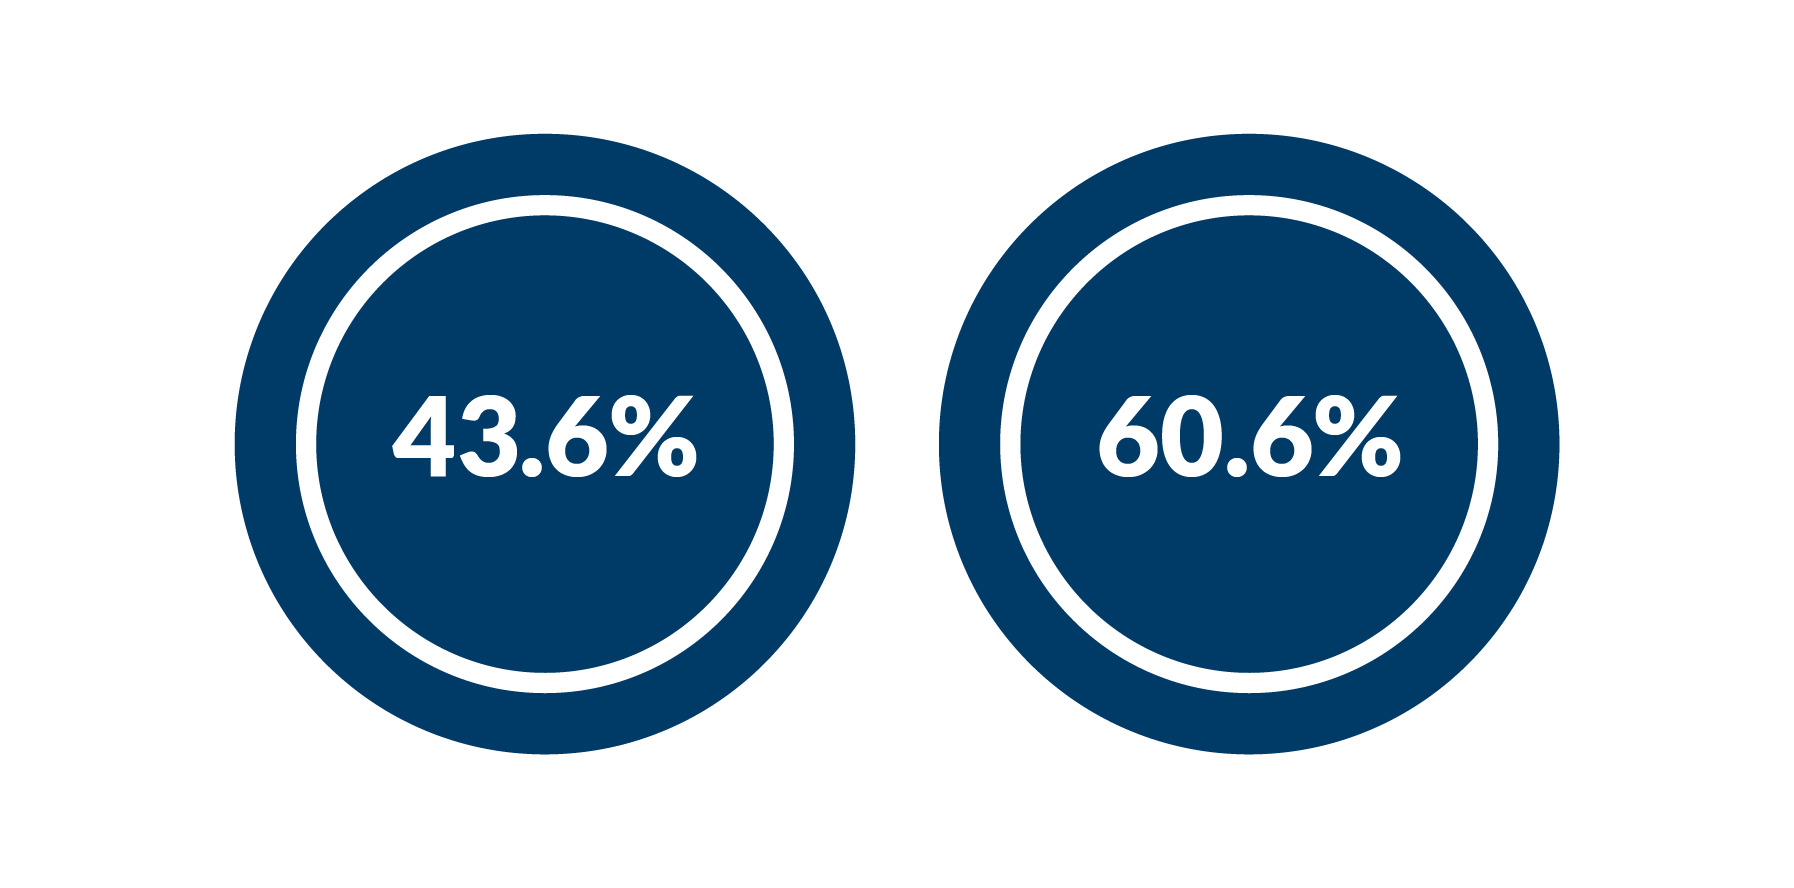
Median bonus gap 43.6%
Mean bonus gap 60.6%
Gender Pay Quartiles

| Quartile | Lower | Q2 | Q3 | Most Senior |
|---|---|---|---|---|
| Female | 63% | 58% | 45% | 29% |
| Male | 37% | 42% | 55% | 71% |
